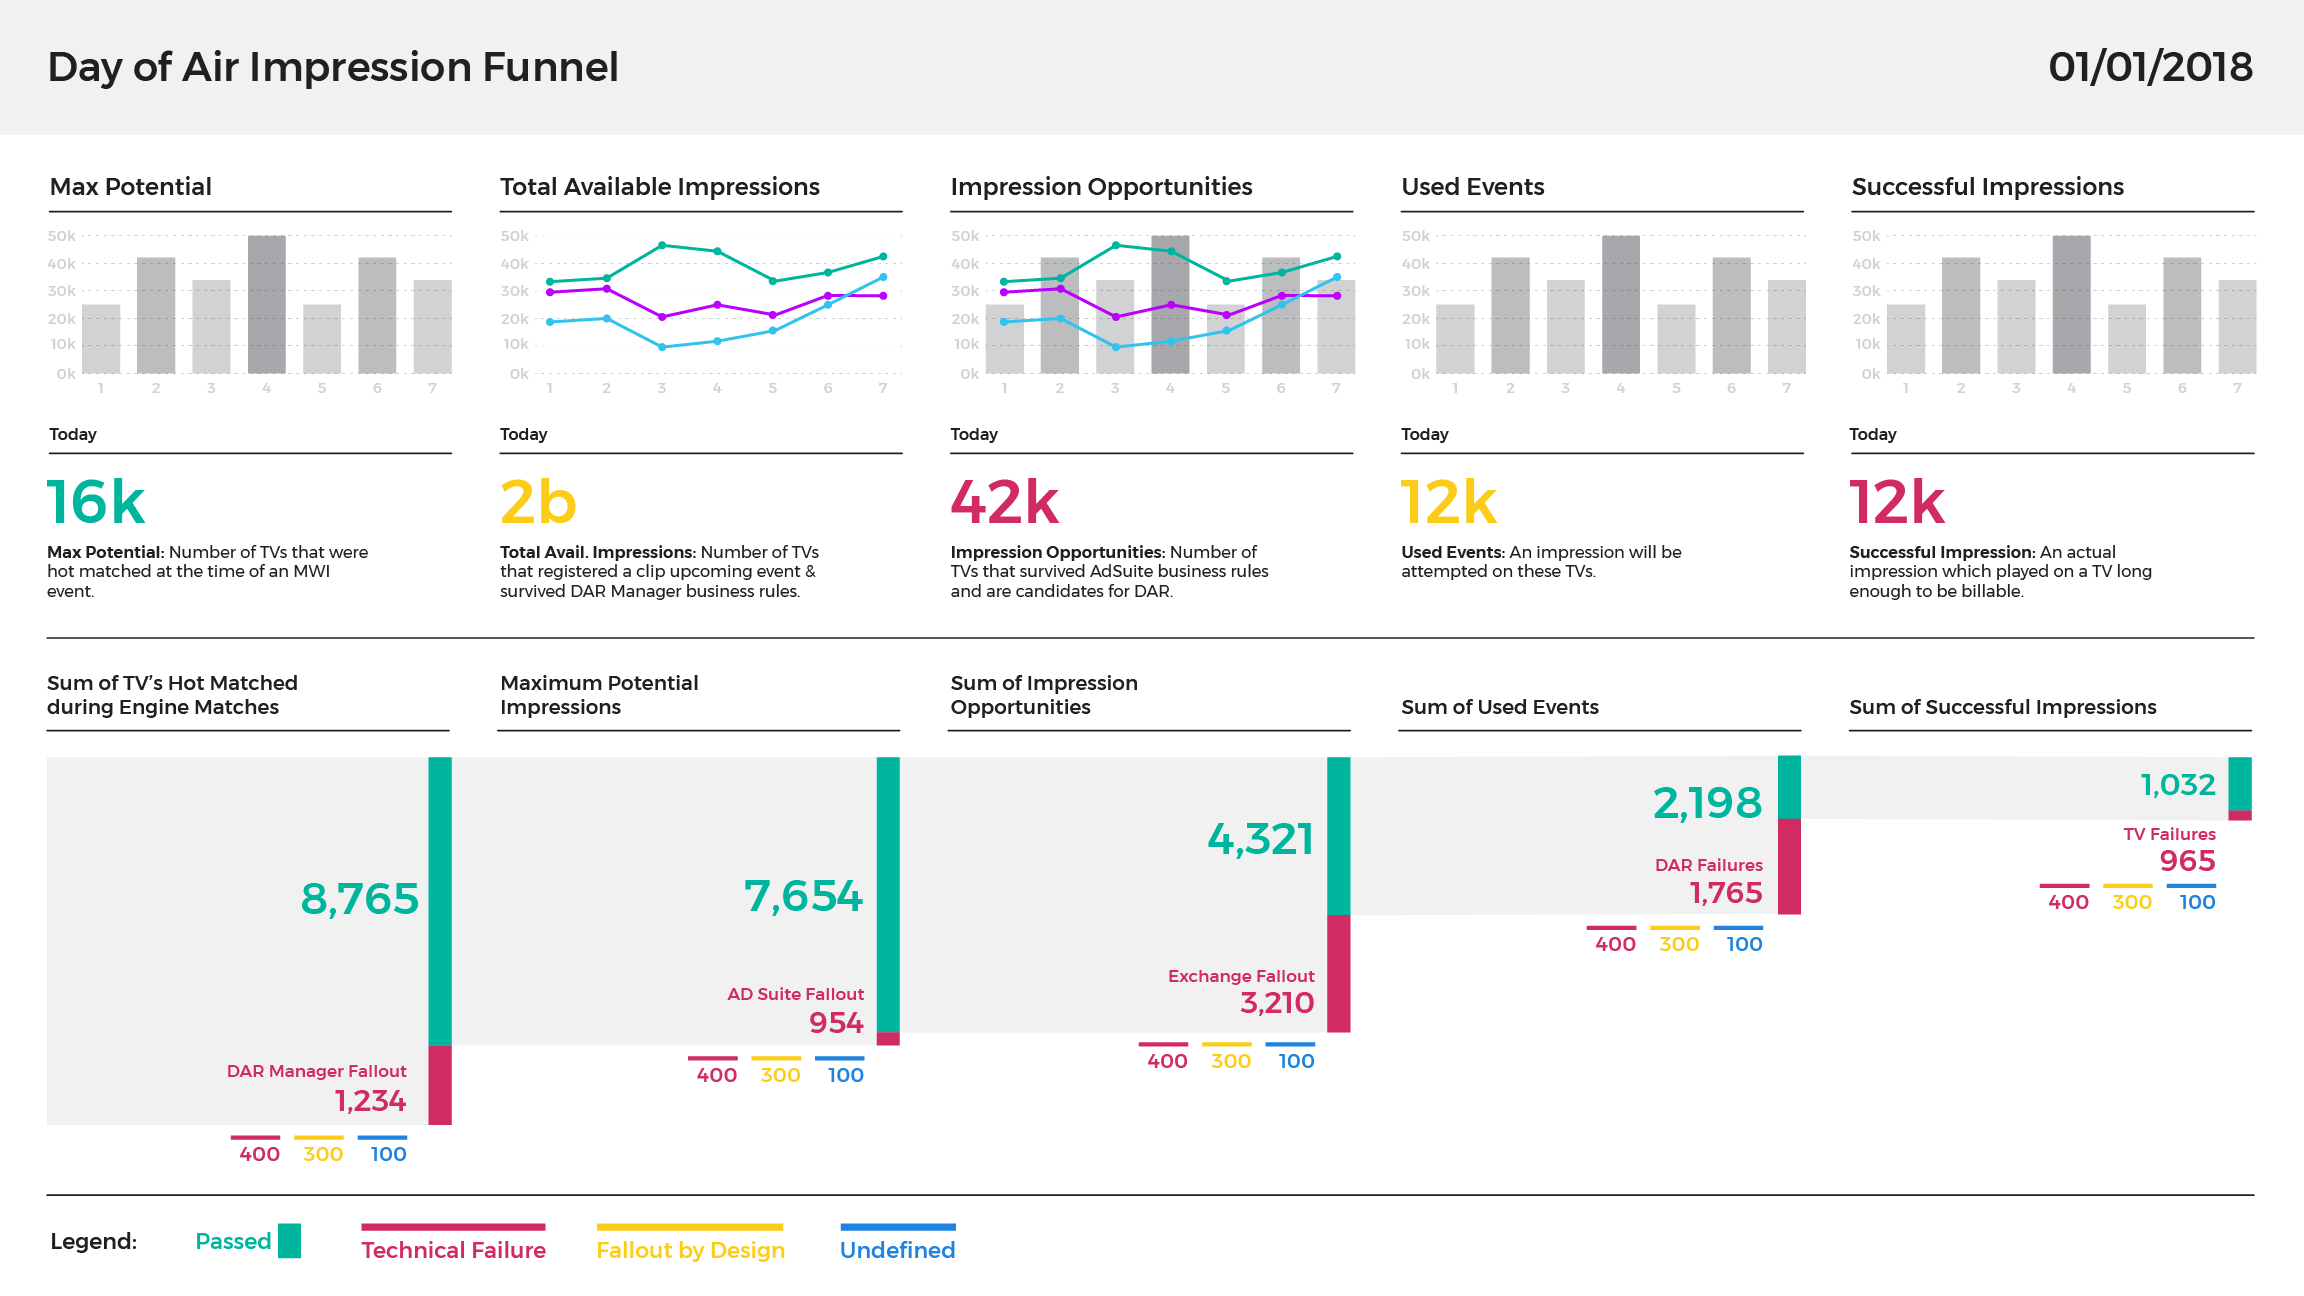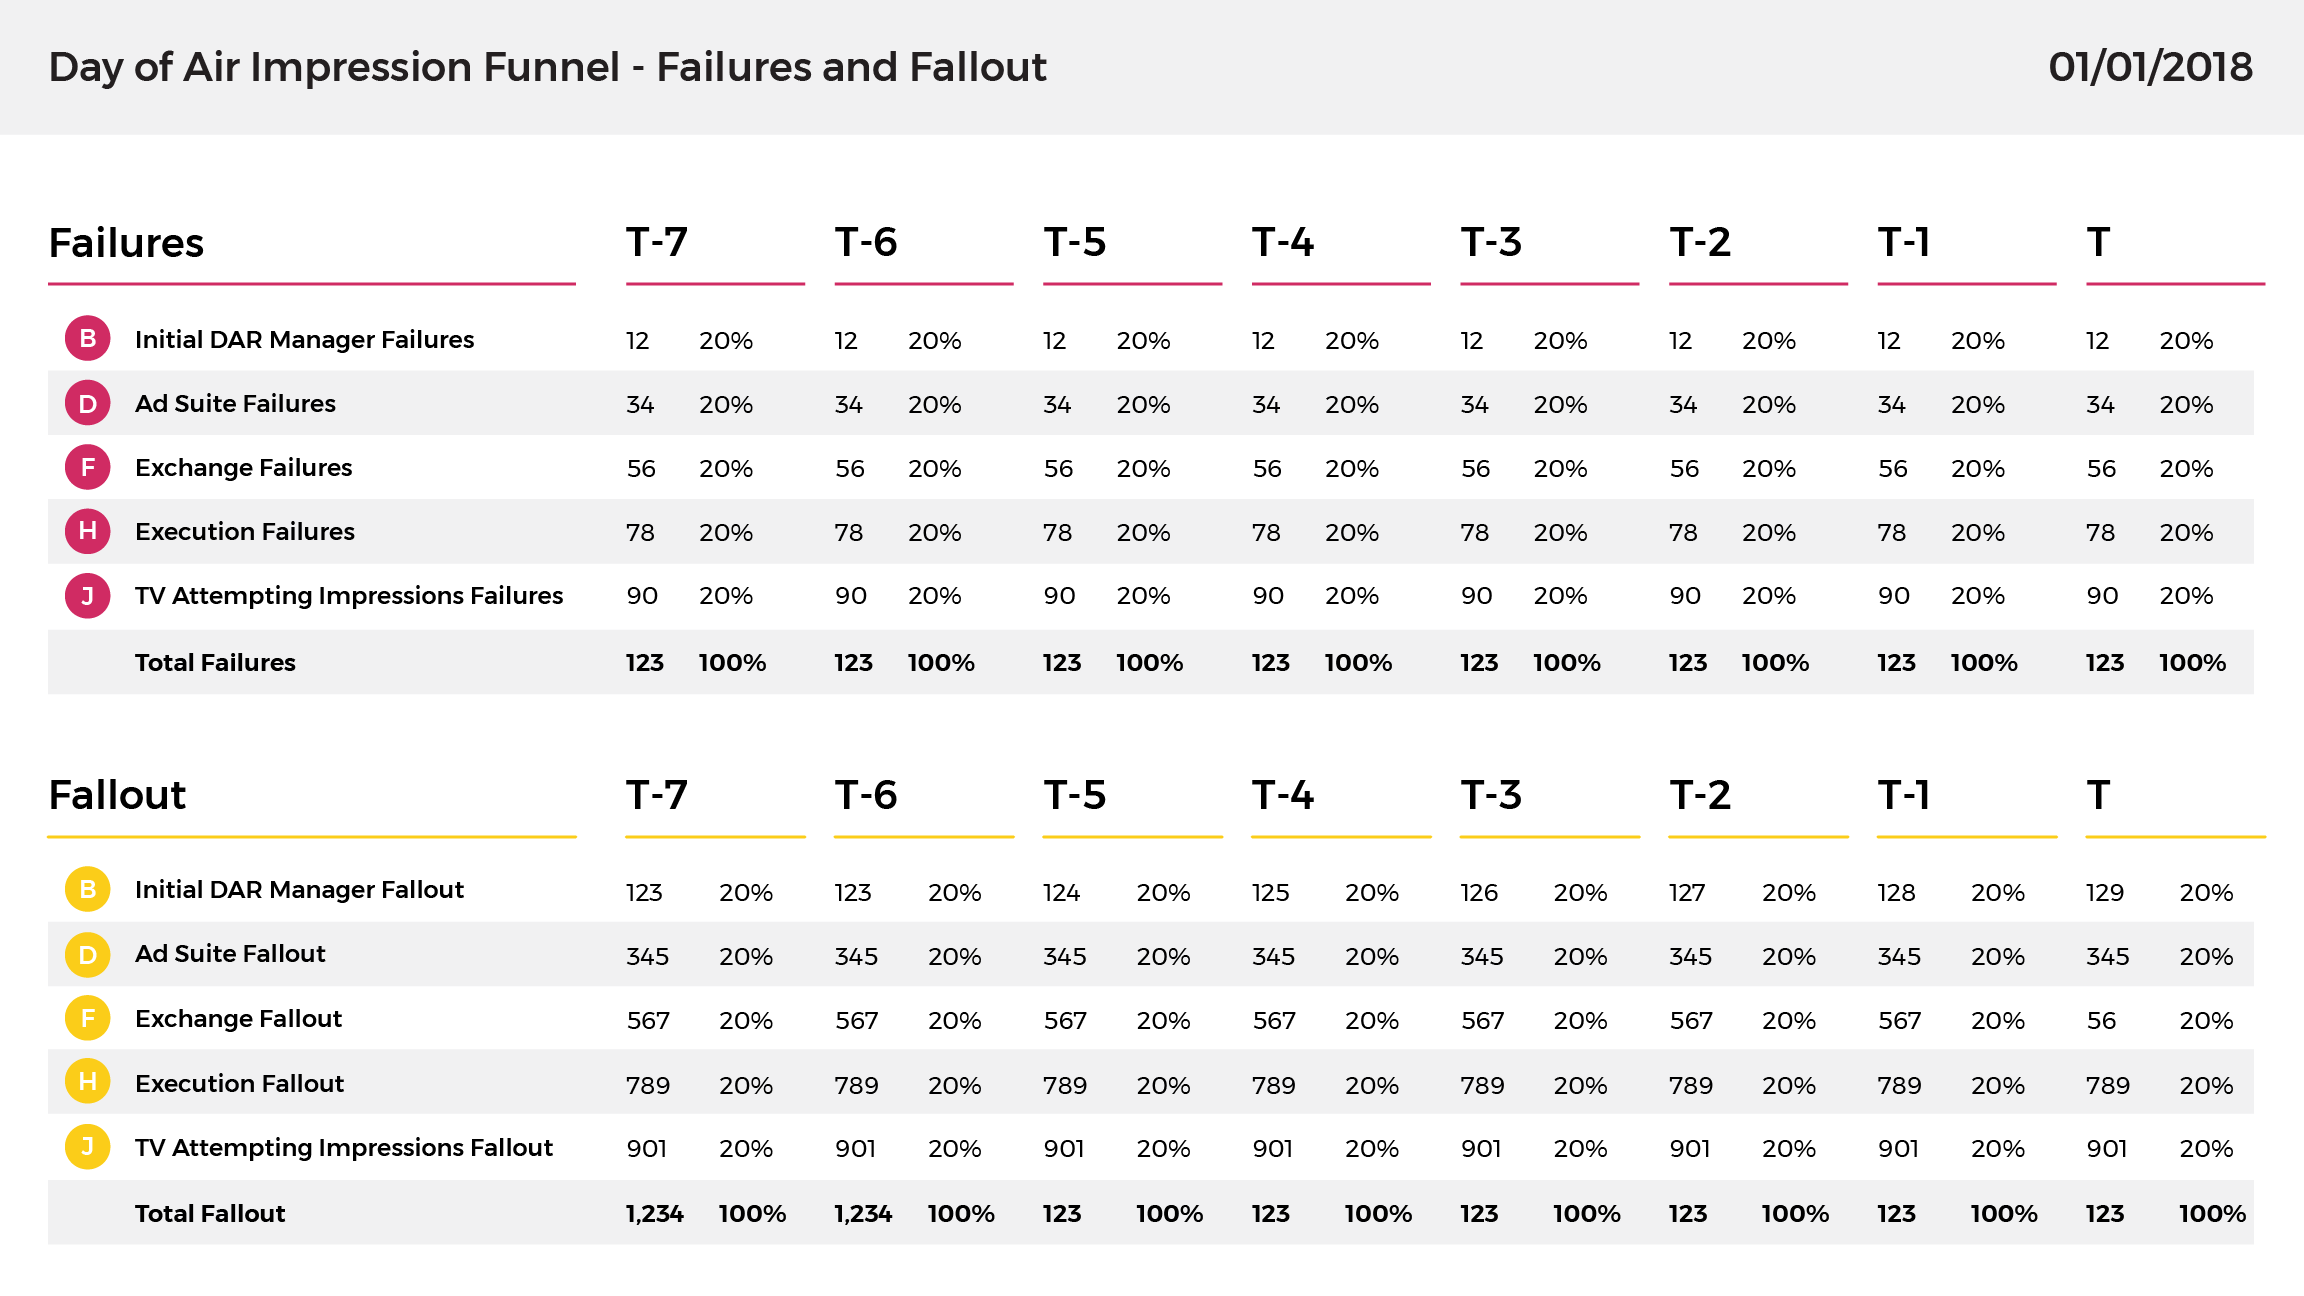

Data Interface
This interface was built to show various steps in a process of preparing the hardware and software of millions of TV’s for the additional software built at Sorenson Media. The interface uses an “Alluvial Diagram”, and represents daily-changing data and multiple categories within categories.


